Introduction
Discussion
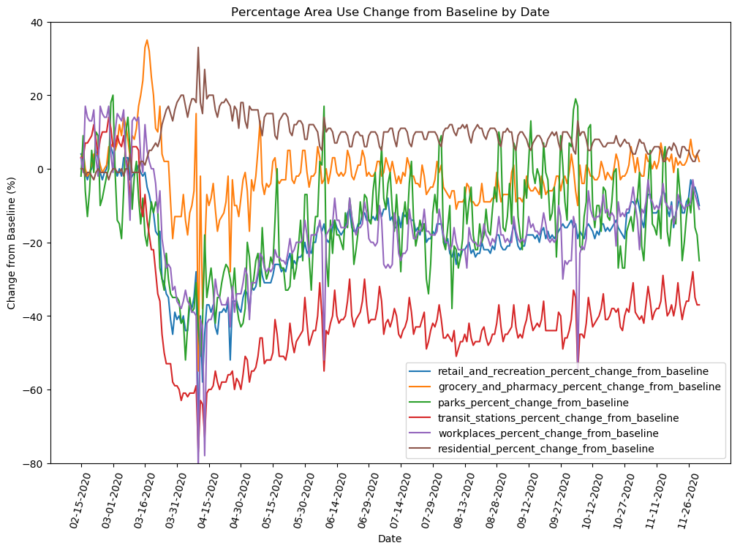
The dataset being used is Google’s COVID-19 Community Mobility Reports, which is a record of changes in people’s movement, grouped by usage of specific area types such as residential, park, etc. Google has created this dataset through two processes. First the data is obtained from users who have their location history turned on in their Google account and who are using mobile devices. In other words the location history tracks the user’s location via their smart phone. Secondly, the report uses a baseline day as a benchmark to compare area usage and then records the change relative to the benchmark. The baseline day is a median value from like days comprising the 5 week period between 3/01/2020 and 06/02/20201. That is to say Fridays are compared to the median value from the 5 Fridays between the 03/01/2020 and the 06/02/2020, which is the baseline.
Source
The dataset was downloaded from Google: https://www.google.com/covid19/mobility/, though access has been granted only temporarily by Google to help with the coronavirus epidemic.
Usefulness of the Dataset
The dataset can help Australia to tackle COVID 19 through a number of mechanisms. Firstly, it can identify areas where there are a lot of people moving about and that are therefore risk areas or areas where people are not adhering to distancing rules. Secondly, it can identify the association between mobility in an area and the spread of COVID 19 should an outbreak occur, thus identifying how effective management techniques proved to be.
Data Exploration
Size
The dataset contains 3342175 entries or rows, with 14 columns and has a file size of 223 MB. It is worth noting that this may be subject to change as the data from Google is dynamic and updated over time.
Format
The format of the dataset is comma separated variables (CSV), which means that it is basically a text file with entries in each row being separated by commas per column value. Overall the columns fall roughly into three categories: geographic data to give the location, the change in use of specific area types relative to the baseline and the date.
Features
It has 14 columns with varying content as detailed in the table below:
| Column Name | Content |
| country_region_code | Country Code, IE: AU |
| country_region | Country Name, IE.: Australia |
| sub_region_1 | State |
| sub_region_2 | City |
| metro_area | Non-Australia Suburb Designation |
| iso_3166_2_code | State in code form, IE: AU-ACT |
| census_fips_code | US specific geographic coding |
| Date | The date the stats were recorded |
| retail_and_recreation_percent_change_from_baseline | Optional shopping and recreation |
| grocery_and_pharmacy_percent_change_from_baseline | Essential shopping |
| parks_percent_change_from_baseline Parks | Parks, national parks, castles, etc. |
| transit_stations_percent_change_from_baseline | Train stations, bus stations, etc |
| workplaces_percent_change_from_baseline | Work sites, corporate areas. |
| residential_percent_change_from_baseline | Homes, apartments, etc. |
Literature Review
Research Example 1 – COVID-19 outbreak response, a dataset to assess mobility changes in Italy following national lockdown
The first piece of research I have chosen is ‘COVID-19 outbreak response, a dataset to assess mobility changes in Italy following national lockdown’ by Emanuele Pepe and team. The article documents the teams work focusing on establishing just how effective non-pharmaceutical interventions (NPIs) have been at controlling the spread of COVID-19 in Italy2. It uses the
mobility data from Google to examine whether measures put in place by governmental authorities have proven successful in changing the movement patterns of the population.
This paper takes quite a sophisticated approach to using the data, feeding it into Gyration radii to examine how much area a person inhabited and comparing it to others. The idea appears to be to model the movement of people and assess risk based on number of ‘collisions’ between different people and therefore the risk of virus spread.
Research Example 2 – Interpreting the effect of social restrictions on cases of COVID-19 using mobility data
The second piece of research I have chosen is ‘Interpreting the effect of social restrictions on cases of COVID-19 using mobility data’, which is a pre-print from the Medical Journal of Australia. This piece of research is particularly useful as it gives a very clear example of how the data set could be used to answer questions in the Australian context.
The researchers coupled data from Australian mobility trends with confirmed COVID-19 case data from John Hopkins University4 . This involved adjusting for the lag period of 11 days between exposure and confirmation of a COVID-19 case. After which mobility trends were examined to check how effective social distancing techniques were in decreasing the ‘doubling time’, a measure of how quickly virus cases grow by measuring the time it takes for number of infected people to double.
Research Question/Selection of the Problem
Selected Research Question
The selected research question is: ‘How effective were government social distancing measures in decreasing people using public areas?’. To approach this question change in use of nonpublic areas (residential and perhaps grocery) will be compared to all of the other areas.
Justification
Although the government put into place social distancing measures, the degree to which they were effective is not clear. Anecdotal measures may be used to assess effectiveness but these measures may not be rigorous. The Google Covid-19 mobility data allows the government and health community the ability to see how effective the measures were with solid, quantitative data. This means a balance can be struck between lockdown policies and public freedom as measures that prove ineffective at slowing the spread of the virus may be exempted.
The specific question chosen is valuable because it correlates the lockdowns and social distancing measures with data of people’s movements. It also does not need much in the way of further data save for the implementation dates of policies after which the change in behavior of people in a region such as Brisbane can be observed.
Data Analysis to Select Subset Data
The research question is, ‘How effective were government social distancing measures in decreasing people using public areas?’. In order to answer this we need to get the dates social distancing measures were implemented for every state and examine how much of an impact this had on the change from baseline use of essential and non-essential areas.
The dataset is split into three levels of detail: national, state and local. As such there is duplicate data as if it were split only on the condition of it being Australia you would get overlapping data as the 6 states and 2 territory data has been recorded separately as has local regional data. For the research question state governments were largely responsible for putting into place social distancing measures and restrictions, so we need state level data only and thus needed to filter
out national and local data from the data set.
When it comes to the data what we are really interested in is whether or not the distancing measures impacted essential and non-essential activities. If the distancing measures were effective, we expect to see an increase in essential activities and a decrease in non-essential activities. As such, we can aggregate activities considered essential and activities considered non-essential. Finding the mean of the aggregates and comparing the means will give us the answers we seek.
Steps to Select Useful Subset
The first step was to load the data into a data frame, examine it to see how it was structured and then isolate the data to Australian data only.
The second step was to examine it for duplicates which I did by looking for overlapping date values. There were overlapping values at the national, state and local level.
The third step was to isolate the state data and then check to see if the previous assumption was correct. After isolating state data and comparing it to national data the number of entries matched up with 291 entries for national data, 2328 entries for state. As 2328 divided by 291 is equal to 8 the data makes sense because Australia has 8 states and territories.
The fourth step was to create two columns of mean aggregate values for essential and non-essential activity data. To create the essential column the two columns ‘grocery_and_pharmacy_percent_change_from_baseline’ and ‘residential_percent_change_from_baseline’ were added together and then divided by 2 to create a Mean_Essential activity change column. To create the non-essential column the four columns ‘retail_and_recreation_percent_change_from_baseline’, ‘parks_percent_change_from_baseline’, ‘transit_stations_percent_change_from_baseline’, ‘workplaces_percent_change_from_baseline’ were added together and divided by 4 to create a Mean_Non_Essential activity change column. The idea being that we are sepearating public areas that are restricted from private and unrestricted public areas to examine the change in use.
The fifth and final step was to drop columns that were not needed, leaving only: iso_3166_2_code, date, Mean_Essential, Mean_Non_Essential. This yields the state, the date and the mean change in essential and non-essential activities.
Database Design Based on the Subset Data
The database is called ‘assignment2’ and contains two collections. The first collection is the state based data for changes in mobility, named ‘State_Mobility’, and the second is the individual measures put in place by each of the states, named ‘State_Measures’:
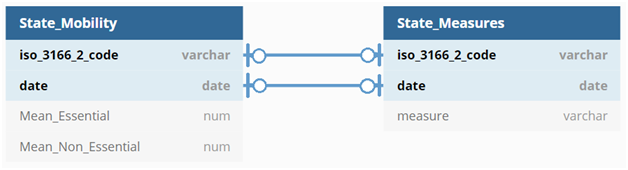
It is worth noting that NoSQL defaults to giving each entry added a unique key by creating a _ID column as the primary key of the collection. However, in our design we have a composite primary key with iso_3166_2_code and date for both collections.
The ‘State_Measures’ data was obtained separately from the mobility data. It was acquired from the Australian Parliamentary House . I went through the listings of state restriction measures to find relevant dates associated with distancing measures and created a csv file of them, then uploaded it as the ‘State_Measures’ collection.
The relationship between the two collections is an optional one-to-one relationship. These two datasets are related, but they are independent so the relationship is optional. Furthermore, for every iso_3166_2_code and date combination there exists one set of values for each table so it is a one-to-one relationship.
Justification
This design was chosen as it gives a list of measures by iso_3166_2_code and date, which will allow us to compare the results of distancing measures to changes in mobility before and after they are implemented by referencing the iso_3166_2_code and date of mobility changes.
Data Analysis
Change in Baseline Area Use (%) for Essential and Non-Essential Areas Ordered by State
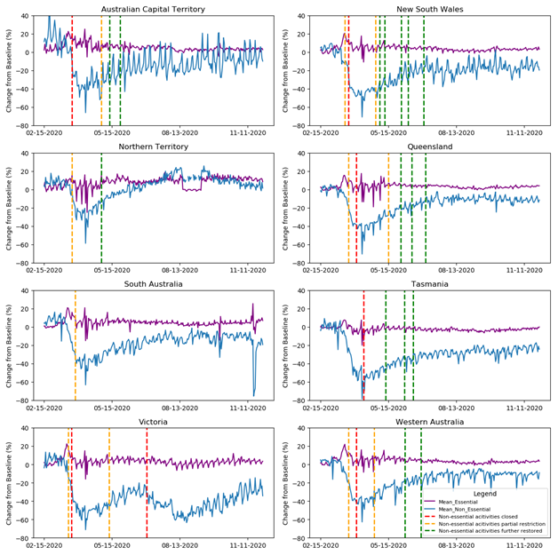
In Figure 3 the red dotted vertical line means full restriction of non-essential activities, orange means partial and green indicates restorations of varying degrees. The purple line plot represents mean change in essential activities and blue represents mean change in non-essential.
The interesting result of the analysis in figure 3 is that although there is some correlation between the implementation of social distancing measures and change in area usage, it does not appear to directly correlate with legislated state government enforcement. To examine this phenomenon further change point analysis was applied to the Victorian and Tasmanian data as these two datasets have quite different restriction dates for their non-essential activities:
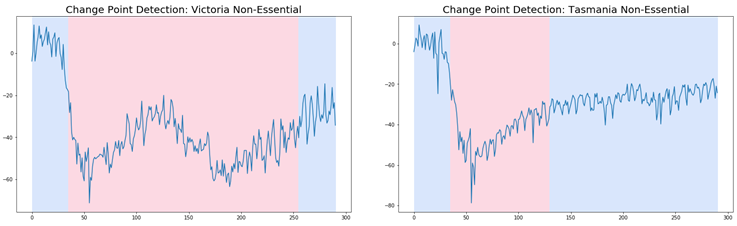
The change point analysis plot (figure 4) shows that there is an area of change in the use of non-essential areas for both Tasmania and Victoria. This detection was achieved using the Pruned Exact Linear Time (PELT) algorithm, which is an efficient way of detecting significant changes in the mean and at what moment that change occurred . Although the change point detection was effective, in order to make use of it we need to map it to the baseline data using the date associated with the change point as a black dotted line:
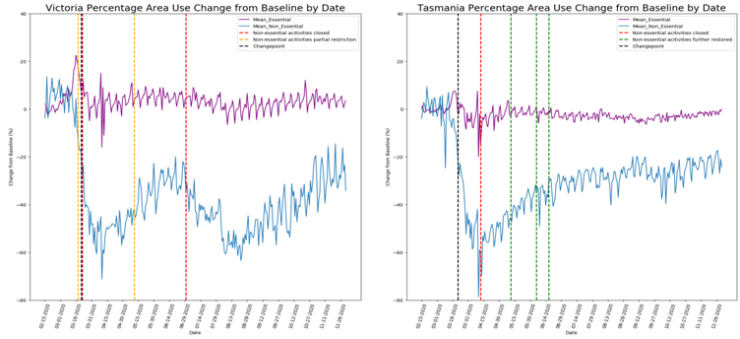
As figure 5 shows change point is correlated with closure of non-essential activities, but the correlation is not always strong. In Victoria the overlap is so close that the first full restriction line is quite hard to see on the plot. However, in Tasmania the change point occurs before the first full restriction and non-essential area use starts to increase after full restriction laws on non-essential areas.
Very curiously the change point date for both Tasmania and Victoria was 03-21-2020, even though the legislation dates were different with 04-12-2020 and 03-22-2020 respectively for Tasmania and Victoria. The change point date with legislation lines up and makes sense for Victoria, but does not make sense for Tasmania. Bizarrely, this would suggest that Tasmania reacted at the same time as Victoria even though legislation only applied to Victoria and later was implemented in Tasmania.
As a result of this change point analysis it is concluded that social distancing measures were effective in influencing social distancing behavior, but some other factor beyond the legislation and enforcement created the effect. The reason for reaching this conclusion is that in Tasmania people began social distancing in line with Victoria, even before the actual date the legislation was introduced there. In other words, Tasmanians reacted to the Victorian government social distancing measures.
It is worth noting that the data may have a slight inherent bias as only people who carry smart phones around are going to be captured in this data set and those people may be more inclined to use and be swayed by social media or to be informed by news media. As such, the people in this group may be hyper alert to distancing measures and more inclined to follow them proactively.
Findings
The main finding is that although there is some relationship between governmental social distancing measures and change in people’s area usage, some other social factor is the primary determinant in changing people’s behavior. As such it is fair to conclude that distancing measures were effective in decreasing people’s use of public areas, but in an indirect manner through some unknown mechanism. One of the really interesting results of the analysis is that it showed people seemed to start social distancing before the rules came into effect. Essentially, people started to copy the behavior of the first state that introduced social distancing measures.
It is hard to determine exactly what this suggests, but it may be the case that the media portrayal of the social distancing measures is more important than the legal aspects of the measures. It could also be word of mouth via social media or even more conventional means that is changing mobility behavior. Another possibility is that people respond out of fear of both covid-19 and being fined. This fear response means that people adopt the social distancing measures even before the measures are enforced by state governments. In other words, people hear about the measures and then adopt them preemptively to avoid covid-19 or being fined, not particularly paying attention to dates.
We also see that regardless of the current law, the laws have the most impact on movement when they are first implemented and then a diminished effect over time. Furthermore, when social distancing measures are relaxed and then re-implemented the second iteration is less effective. To add further to this after the initial response people may increase their use of restricted areas even when laws prohibit it.
Ethics and Privacy
Google employed a number of techniques to protect the privacy of its users. The first step was removing all information from the dataset that could potentially identify an individual such as name, address, etc. However, although this measure is a strong privacy measure and may be sufficient in many cases Google took further steps to protect user privacy.
The second step was to limit the publication of areas that were too small, with the minimum size for a geographic area being 3km2 . The idea with this privacy measure is that a small geographical area being discussed risks identifying individuals by their behavior, but if the area is large enough identifying individuals becomes impractical.
The third step was to remove observations in which the number of users were too small, namely when the number of users was less than 100 . The idea is that if the number of users is particularly small there is a risk that people will know which individual or small group was in a given area at a given time and will therefore be able to identify them. As such this data was excluded.
The fourth step was the employment of a more advanced mathematical technique, called ‘differential privacy’, which adds noise to the data without significantly affecting its accuracy . The math here is somewhat sophisticated and involves running a query through a filter that applied ‘Laplace noise’ so that even the person extracting the data cannot know the exact details of it.
Australian Law
There is only really one relevant law for this particular data set: the Privacy Act of 1988, which is most often implemented by the simplified 13 Australian Privacy Principles (APPs). Our use of the data and Google’s use meets these principles as the data is not considered sensitive information. It also meets the criterion of being de-identified as Google have taken measures to make it impossible to reasonably identify anyone. Data is purpose limited, so the reason for collecting the data is to inform covid related policy decisions . As a result the use of this data is considered in line with the Privacy Act of 1988.
Reference
Aktay, A., Bavadekar, S., Cossoul, G., Davis, J., Desfontaines, D., Fabrikant, A., Gabrilovich, E., Gadepalli, K., Gipson, B., Guevara, M., Kamath, C., Kansal, M., Lange, A., Mandayam, C., Oplinge, A., Pluntke, C., Roessler, T., Schlosberg, A., Shekel, T., Vispute, S., Vu, M., Wellenius, G., Williams, B. and Wilson, R., 2020. Google COVID-19 Community Mobility Reports: Anonymization Process Description (version 1.1). arXiv Pre-print,.
Australian Government – Federal Register of Legislation. n.d. Privacy Act 1988. [online] Available at: https://www.legislation.gov.au/Series/C2004A03712 [Accessed 2021].
Killick, R., Fearnhead, P. and Eckley, I., 2012. Optimal Detection of Changepoints With a Linear Computational Cost. Journal of the American Statistical Association, 107(500), pp.1590-1598.
Pepe, E., Bajardi, P., Gauvin, L., Privitera, F., Lake, B., Cattuto, C. and Tizzoni, M., 2020. COVID-19 outbreak response, a dataset to assess mobility changes in Italy following national lockdown. Scientific Data, 7(1).
OAIC. 2021. Australian Privacy Principles Quick Reference. [online] Available at: https://www.oaic.gov.au/privacy/australian-privacy-principles/australian-privacy-principles-quick-reference/ [Accessed 4 January 2021].
Storen, R. and Corrigan, N., 2021. COVID-19: A Chronology Of State And Territory Government Announcements (Up Until 30 June 2020) – Parliament Of Australia. [online] Aph.gov.au. Available at: https://www.aph.gov.au/About_Parliament/Parliamentary_Departments/Parliamentary_Library/pubs/rp/rp2021/Chronologies/COVID-19StateTerritoryGovernmentAnnouncements [Accessed 4 January 2021].
Tran, T., Sasikumar, S., Hennessy, A., O’Loughlin, A. and Morgan, L., 2020. Interpreting the effect of social restrictions on cases of COVID-19 using mobility data. The Medical Journal of Australia,.