Result Summary: It was expected that minor changes to brightness and/or contrast for product images would improve the effectiveness of Facebook advertisements. The statistical analysis showed that it did not.
Statement of the Problem: To find whether making minor increases or decreases to the contrast and brightness of an image effects advertising cost per click for Facebook advertisements.
Objective of the Experiment: Find if minor changes to brightness or contrast decrease advertising cost per click for Facebook advertisements.
Date of Experiment: (7 June 2020)
RESPONSE VARIABLE: The response variable is ‘cost per click’ – the amount it costs to get one person to click on the advertisement. It is a quantitative variable measured in Australian dollars.
EXPLANATORY VARIABLES: Two variables or factors are controlled – (1) Brightness Delta, and (2) Contrast Delta. These represent minor changes in brightness and contrast settings of the image. Levels of both of these variables are set at -10%, 0%, +10% and +20%. It is unclear what the optimal settings of those two variables should be but one of two conjectures seems likely: (1) The image is already set at the optimum by the photographers and graphic designers that created it (2) Increasing the image’s brightness and contrast will make the image stand out more and thus lower the cost per click as it will get more people’s attention.
CONTROLLED AND UNCONTROLLED VARIABLES: There are many other variables at play in this scenario, largely uncontrollable though some can be controlled. The main controllable variables are the demographic variables. Facebook allows advertisers to target based on demographic such as age, gender, location and interests. For this campaign there was no specific demographic targeting applied but in principle this variable can be controlled for. Facebook’s system is also capable of controlling for further variables including interests. An advertisement can be targeted at a certain group based on traits on their profile, so to some degree further profiling is possible. Once again, for the sake of this experiment a blanket approach of targeting all demographics within Australia was taken.
There are also some considerable uncontrolled variables. The first that stands out most prominently is that Facebook’s underlying algorithms attempt to optimize the viewer targeting for effect. This means that it is not randomized as Facebook’s system is attempting to match the advertisements to viewers. So while variables such as the demographic targeting are controllable, the control is limited to giving a range after which Facebook’s internal systems optimize further. The second considerable uncontrolled variable is context. It is not particularly possible to control what type of content the advertisement is associated with as it simply shows up in people’s Facebook feeds. This means that it could be next to all manner of other content.
THE EXPERIMENTAL DESIGN: An unbalanced quasi-experiment run as a 3×4 fractional factorial block design. This experiment was repeated for each treatment group four times, with the same amount spent each time and then the average cost per click recorded. The experiment is unbalanced as controlling the number of people that see the advertisement is not possible within Facebook’s system. It is quasi-experimental as a randomized experimental design is not possible given that Facebook ultimately controls who the advertisements are shown to. Although a full factorial design would be possible in this case, it was opted against due to budgetary considerations. These compromises away from ideal experimental design are considered acceptable due to budget and that the design should provide enough information to achieve the objective of the experiment: to show whether slight changes in brightness and contrast have a significant impact on an advertisements cost per click effectiveness.
DATA COLLECTION: The data collected was collected from Facebook’s backend advertisement manager. $2 was spent on each treatment, applied four times for each of the ten treatments, and the average cost per click was recorded.
EXPERIMENTAL PROCEDURE: Ten different advertisements are purchased. Four sets of $2 worth of advertising budget are spent on each of the ten advertisements. This was designed to test the impact on changing the brightness or contrast of an image. Namely, it was to test which of the advertisements gets a lower cost per click and is therefore considered more effective.
The table below includes a small version of the creative image used in the advertisements:
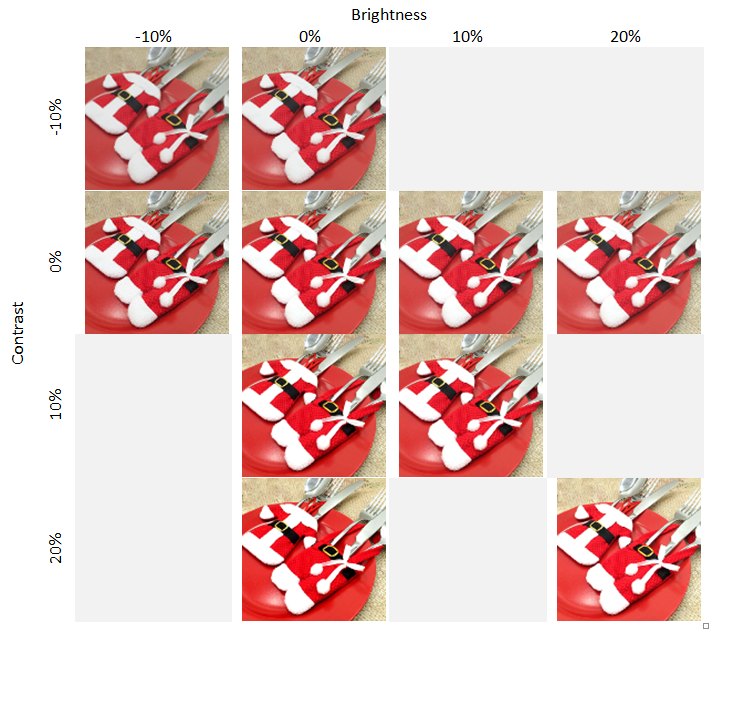
Table 1: Creative images used in advertisements ordered by brightness and contrast.
EXPERIMENTAL RESULTS: The mean cost-per-click for each creative image in each block are recorded in Table 2.
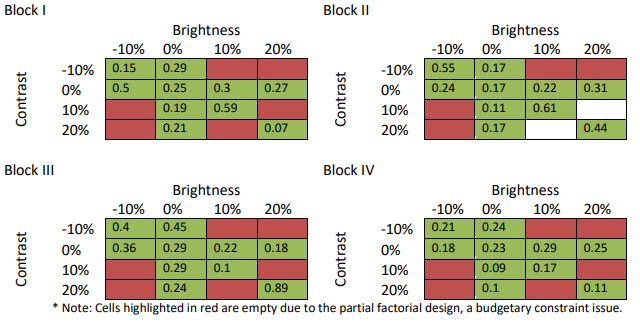
Table 2: Cost per click – mean cost per click in Australian Dollars.
The mean cost per click for each treatment is listed in the table below:

Table 3: Mean cost per click
ANALYSIS: The analysis is based on the mean of the four repetitions at each treatment combination with the exception of those excluded due to the partial factorial design. It is not expected that a significant treatment-block interaction will occur. The scatter plot below (Figure 1) suggests that there are differences among the blocks, but that none of these differences are systematic.

Figure 1: Dot plot of Cost Per Click by treatment number.
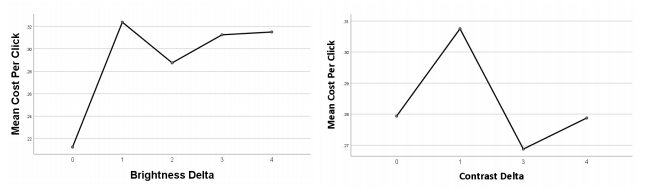
Figure 2: Plots of the main effects of the two factors, brightness delta and contrast
delta.

Figure 3: Plot of the interaction effect between the two factors, brightness delta and contrast delta. Note that due to the partial factorial design a full interaction plot is not possible.
As the block effects are not significant no further analysis of them is required. Analysis using a one-way ANOVA (Appendix A) to compare each of the treatments individually showed that none of the treatment groups substantially deviated from the rest (F = 0.626, p = 0. 766). This in turn means that none of them were more effective at increasing cost per click, but it also means that none of them were less effective at increasing cost per click. There are no issues concerning homoscedasticity or normality assumptions, but the independence assumption is impossible to fully test given it is a quasi-experiment. Likely, the results are independent due to the sheer number of potential advertisement viewers on Facebook.
Further analysis using a two-way ANOVA (Appendix B) showed that the main effect of the two factors, brightness and contrast, and the interaction effect were not significant (Brightness: F =1.005, p = 0.420. Contrast: F = 0.481, p = 0.698. Interaction: F= 0.697, p = 0.506). However, while they were all considered not significant the test clearly showed that brightness was more significant compared to contrast and the interaction effect of the two.
CONCLUSIONS AND RECOMMENDATIONS: If we were to simply choose the best from the list of values then it would seem that the 10% contrast increase and 0% brightness increase has the
lowest cost-per-click at an average of 0.17 over the four tests. Without doing any further analysis this would suggest that increasing the contrast just a little on images can be beneficial, but changing the brightness achieves nothing. The two-way ANOVA contradicts this, however, with the test for the effect of brightness being more significant than the test for contrast. The one-way ANOVA shows that there is no significant difference between any of the treatment groups with a p-value of 0.766 at a level of risk of α = 0.05. This in turn means that no changes in brightness or contrast levels had a significant effect on the results. Furthermore, this is quite a large p-value and so the ANOVA strongly suggests that making minor changes to brightness and contrast has no impact on the cost per click of the advertisement on Facebook.
At first glance this result would seem to undermine the experiment somewhat as ultimately no path to value creation has been found. However, it does suggest something quite curious about images used in advertisements on Facebook. The assumption would be that the professional photographers who create product images have already optimized the brightness and contrast and thus we would expect changes to be counter-productive to the effectiveness of the image. However, the results of this experiment suggest that the image colour settings may not be particularly important at all. Given that part of the cost of hiring professional photographers is their ability to apply colour grading the results may suggest the professional quality of images is not as important as intuition would suggest, at least insofar as getting people to click on the advertisement is concerned. It would be recommended that the content of the image is much more important than its brightness and contrast settings, and perhaps also its general quality though further experimentation would be required to verify that recommendation fully.
In terms of limitations of the experiment it is worth noting that this was not a full factorial design as that would have required every possible combination of brightness and contrast. Certain combinations, such as -10% brightness and +20% contrast were not included due to the previously mentioned budgetary concerns. As such there are still some potential combinations that might prove effective and so it has not been ruled out completely that minor brightness and contrast changes might impact the cost per click effectiveness. However, the process of optimizing would not be simple and would not have a strong effect, likely not having a significant effect at all
It is also worth noting that only one advertising image was used, whereas ideally more would be used. This was limited once again due to budgetary considerations. There may be cases where optimizing the colour quality could be greatly beneficial, if the image is too dark and unrecognizable for example